Kubernetes HomeLab
I’ve been using my old laptop as homelab server for a year or so. Previously I used docker-compose to deploy different services. For a single or multiple user docker-compose is definitely the best way to set up a homelab server. But if you have few number of users Kubernetes could be the optimal solution. In this blog I’ll be deploying a media server using k8s and also a monitoring solution and make it accessible from everywhere.

Why Kubernetes for Homelab?#
While Docker Compose works well for simple setups, Kubernetes offers:
- Automatic Scaling - Handle multiple users efficiently
- Self-Healing - Automatic container replacement
- Resource Efficiency - k3s uses half the memory of standard K8s
- Enterprise Features - Namespaces, RBAC, and network policies
Implementation Overview#
1. k3s Installation#
why k3s over k8s:#
- Single-binary installation (<100MB)
- SQLite backend for lightweight operation
- Automatic certificate management
Installation steps#
curl -sfL https://get.k3s.io | sh - # only works on Linux Server/Desktop
Best practices:#
copy the config of /etc/rancher/k3s/k3s.yaml to ~/.kube/config and ‘chmod 600 ~/.kube/config’
Put these commands in .bashrc file for persistence.
alias kubectl='sudo k3s kubectl'
export KUBECONFIG=/home/pawan/.kube/config
2. setting cloudflared agent on server#
I’ve installed cloudflared docker agent:
- Cloudflare Tunnel setup through Docker, this runs as a daemon/background_service.
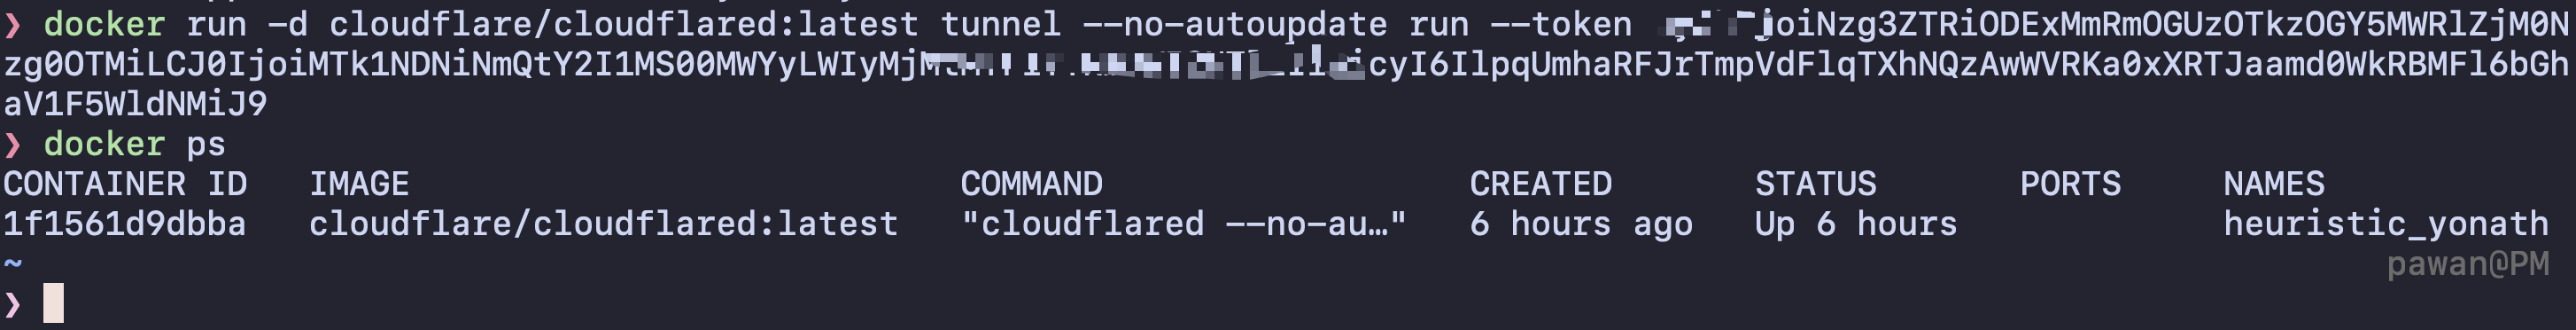
 Tunnel is setup from cloudflare to the server.
3. Media Server (Jellyfin)#
I’m setting up jellyfin to host my downloaded movies, tv_shows, music, books, audioBooks, podcasts. There is hostPaths mentioned below in the configuration file where our media stuffs are stored/downloaded which will be streamed.
k8s file Configuration#
❯ cat jellyfin.yml
#Namespace isolation
#Creating a jellyfin namespace

apiVersion: v1
kind: Namespace
metadata:
  name: jellyfin


---
#Creating a Deployment with resouce allocation
#transcoding can consume too much resources at times depending on media

apiVersion: apps/v1
kind: Deployment
metadata:
  name: jellyfin
  namespace: jellyfin
  labels:
    app: jellyfin
spec:
  replicas: 1      # I'm the only user using it
  selector:
    matchLabels:
      app: jellyfin
  template:
    metadata:
      labels:
        app: jellyfin
    spec:
      containers:
      - name: jellyfin
        image: jellyfin/jellyfin
        ports:
        - containerPort: 8096
        resources:
          requests:
            memory: "512Mi"  # Requesting 512Mi of RAM
            cpu: "500m"      # Requesting 0.5 CPU core
          limits:
            memory: "2Gi"    # Limiting to 2Gi of RAM
            cpu: "2000m"     # Limiting to 2 CPU cores
        volumeMounts:
        - name: config-volume
          mountPath: /config
        - name: cache-volume
          mountPath: /cache
        - name: media1
          mountPath: /media1
        - name: media2
          mountPath: /media2
        - name: media3
          mountPath: /media3
        - name: media4
          mountPath: /media4
        - name: media5
          mountPath: /media5
        - name: media6
          mountPath: /media6
#HostPath volumes for media libraries, fixed directories where we store/download media
      volumes:
      - name: config-volume
        hostPath:
          path: /home/pawan/k8s_homelab/jellyfin/scratch/config
      - name: cache-volume
        hostPath:
          path: /home/pawan/k8s_homelab/jellyfin/scratch/cache
      - name: media1
        hostPath:
          path: /home/pawan/Storage/Movies/
      - name: media2
        hostPath:
          path: /home/pawan/Storage/tv_shows/
      - name: media3
        hostPath:
          path: /home/pawan/Storage/Books/
      - name: media4
        hostPath:
          path: /home/pawan/Storage/music/
      - name: media5
        hostPath:
          path: /home/pawan/Storage/AudioBooks/
      - name: media6
        hostPath:
          path: /home/pawan/Storage/podcast/


---
# Exposing jellyfin through my local_ip:30096
# NodePort service exposure

apiVersion: v1
kind: Service
metadata:
  name: jellyfin
  namespace: jellyfin
  labels:
    app: jellyfin
spec:
  type: NodePort
  ports:
  - port: 8096
    targetPort: 8096
    nodePort: 30096  # This is optional; Kubernetes will automatically assign a port if you omit this line
    protocol: TCP
  selector:
    app: jellyfin
 A instance/replica of jellyfin app is running successfully.
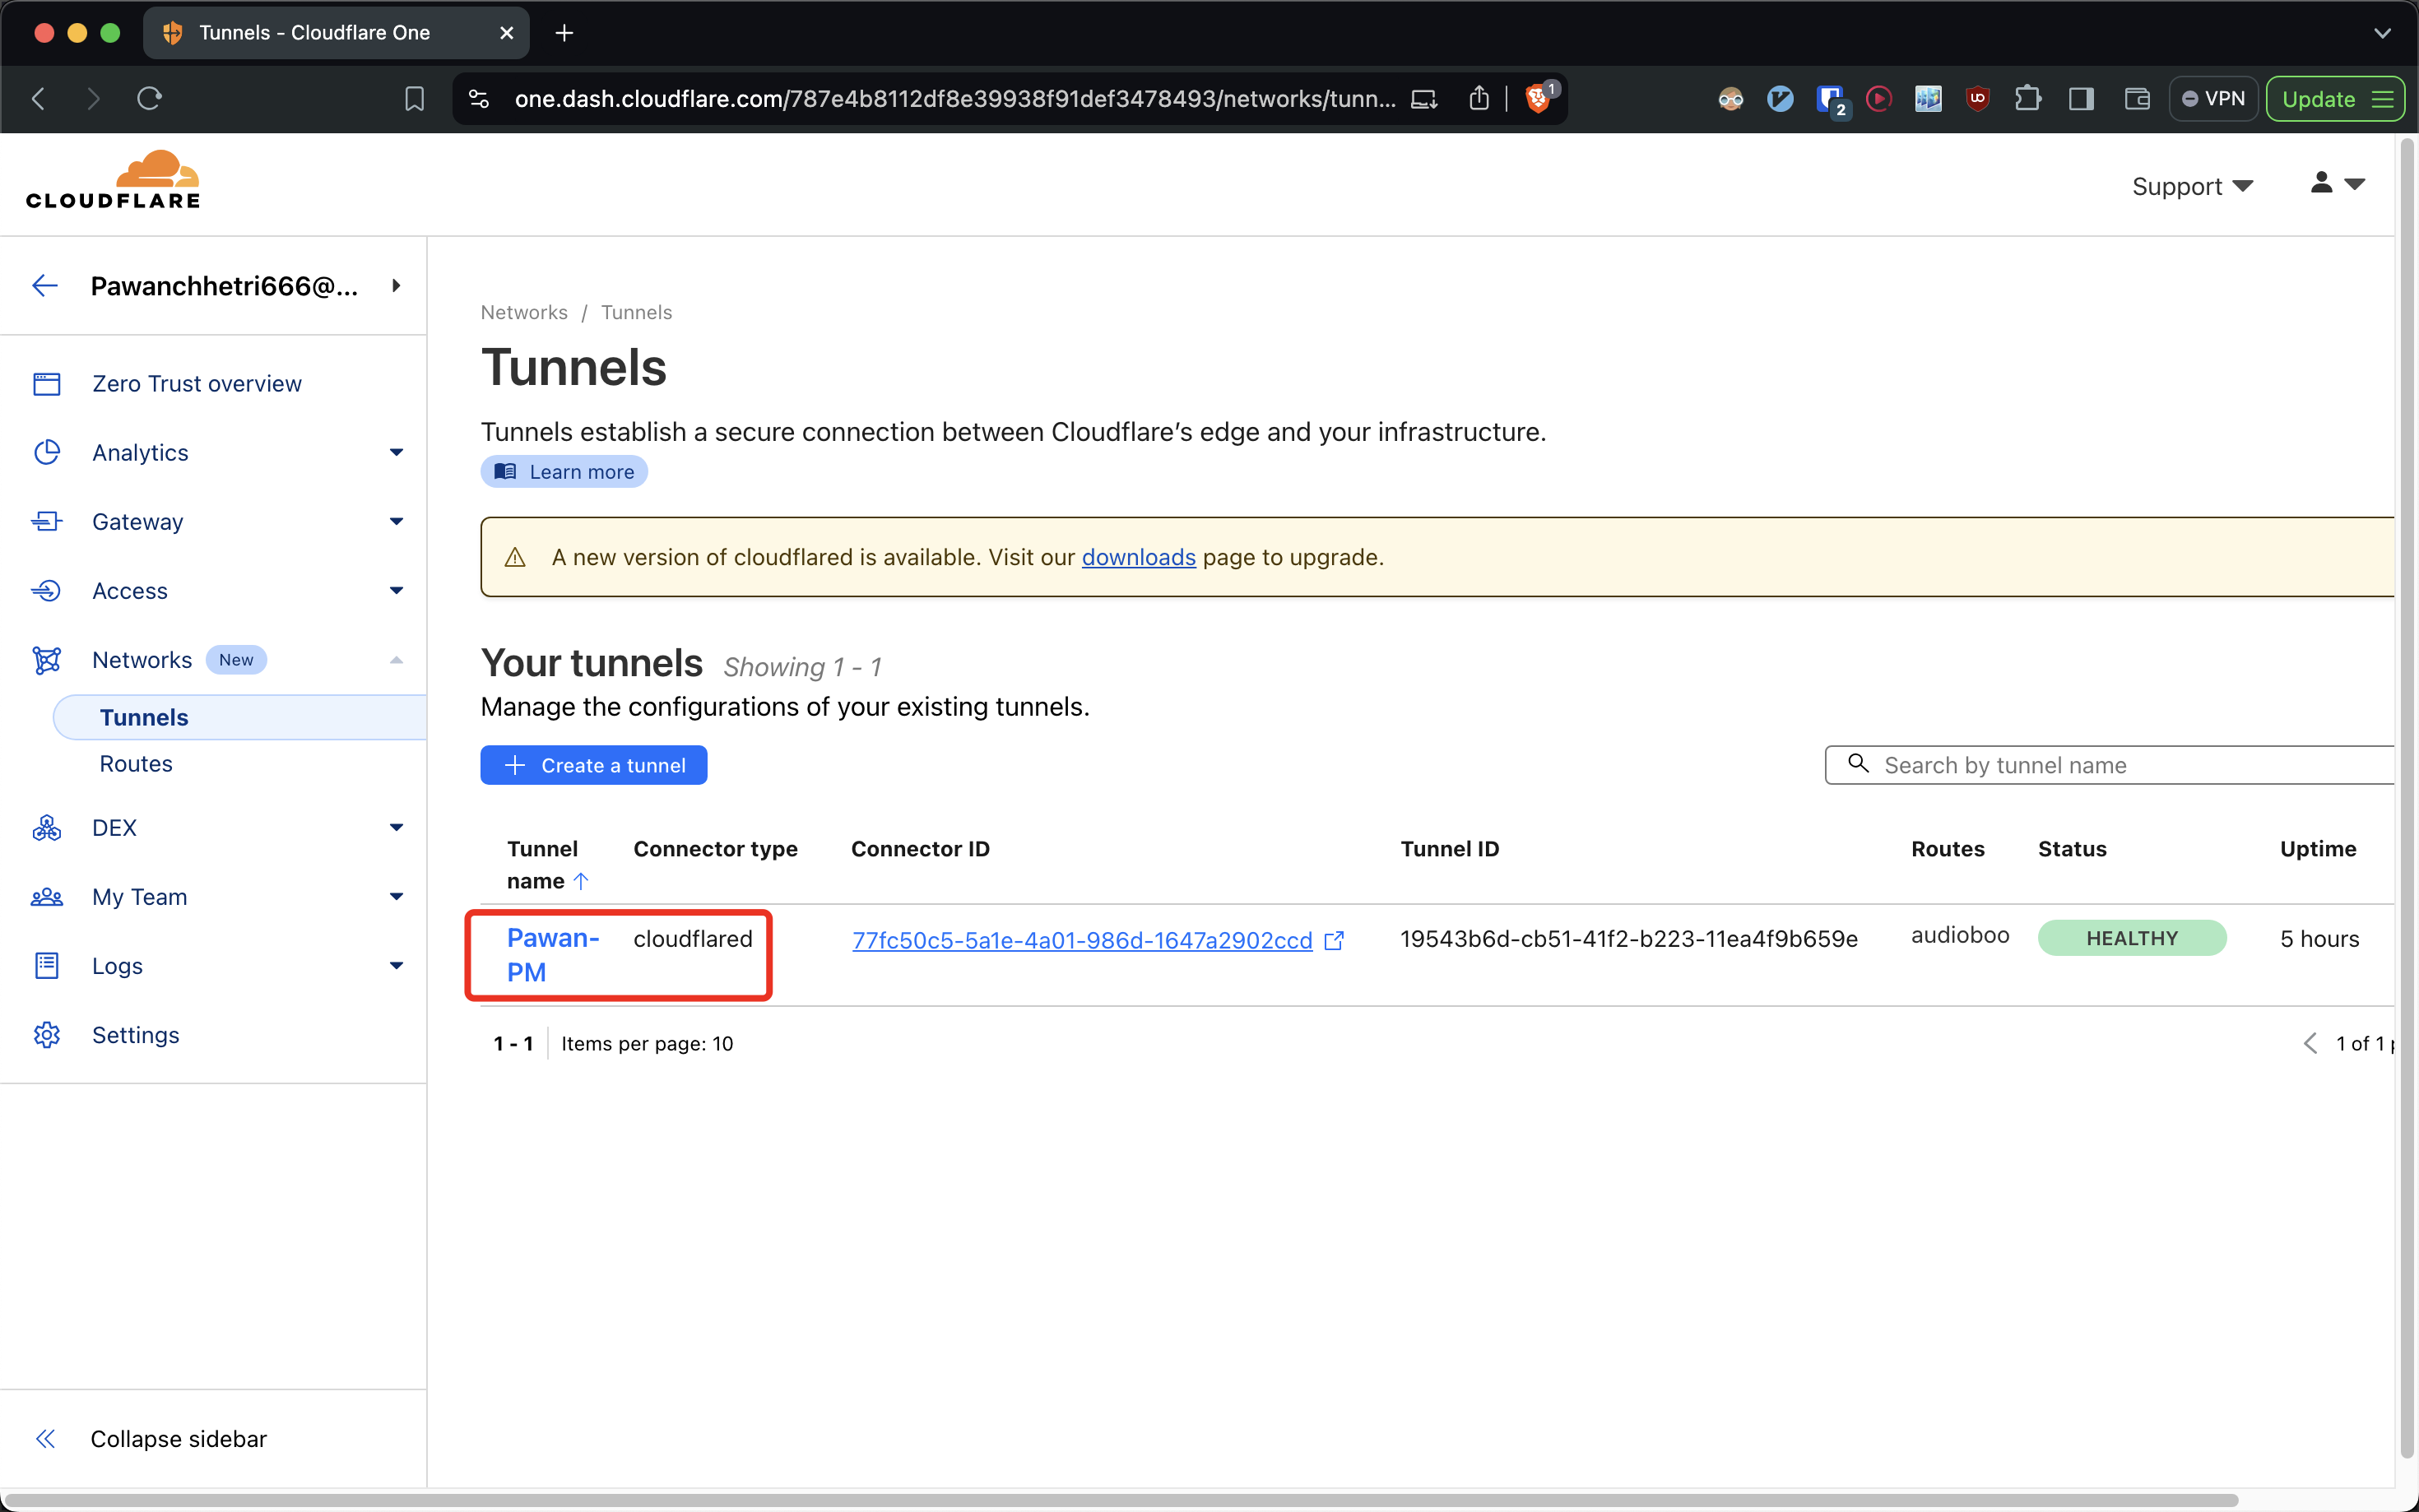
4. Network and Subdomain Mapping#
Static IP assignment on host machine
If not we have to change ip in cloudflare console everytime the server reboots.
DNS configuration for subdomains
Using cloudflare zero trust to map subdomains of our choice to socket(ip:port)
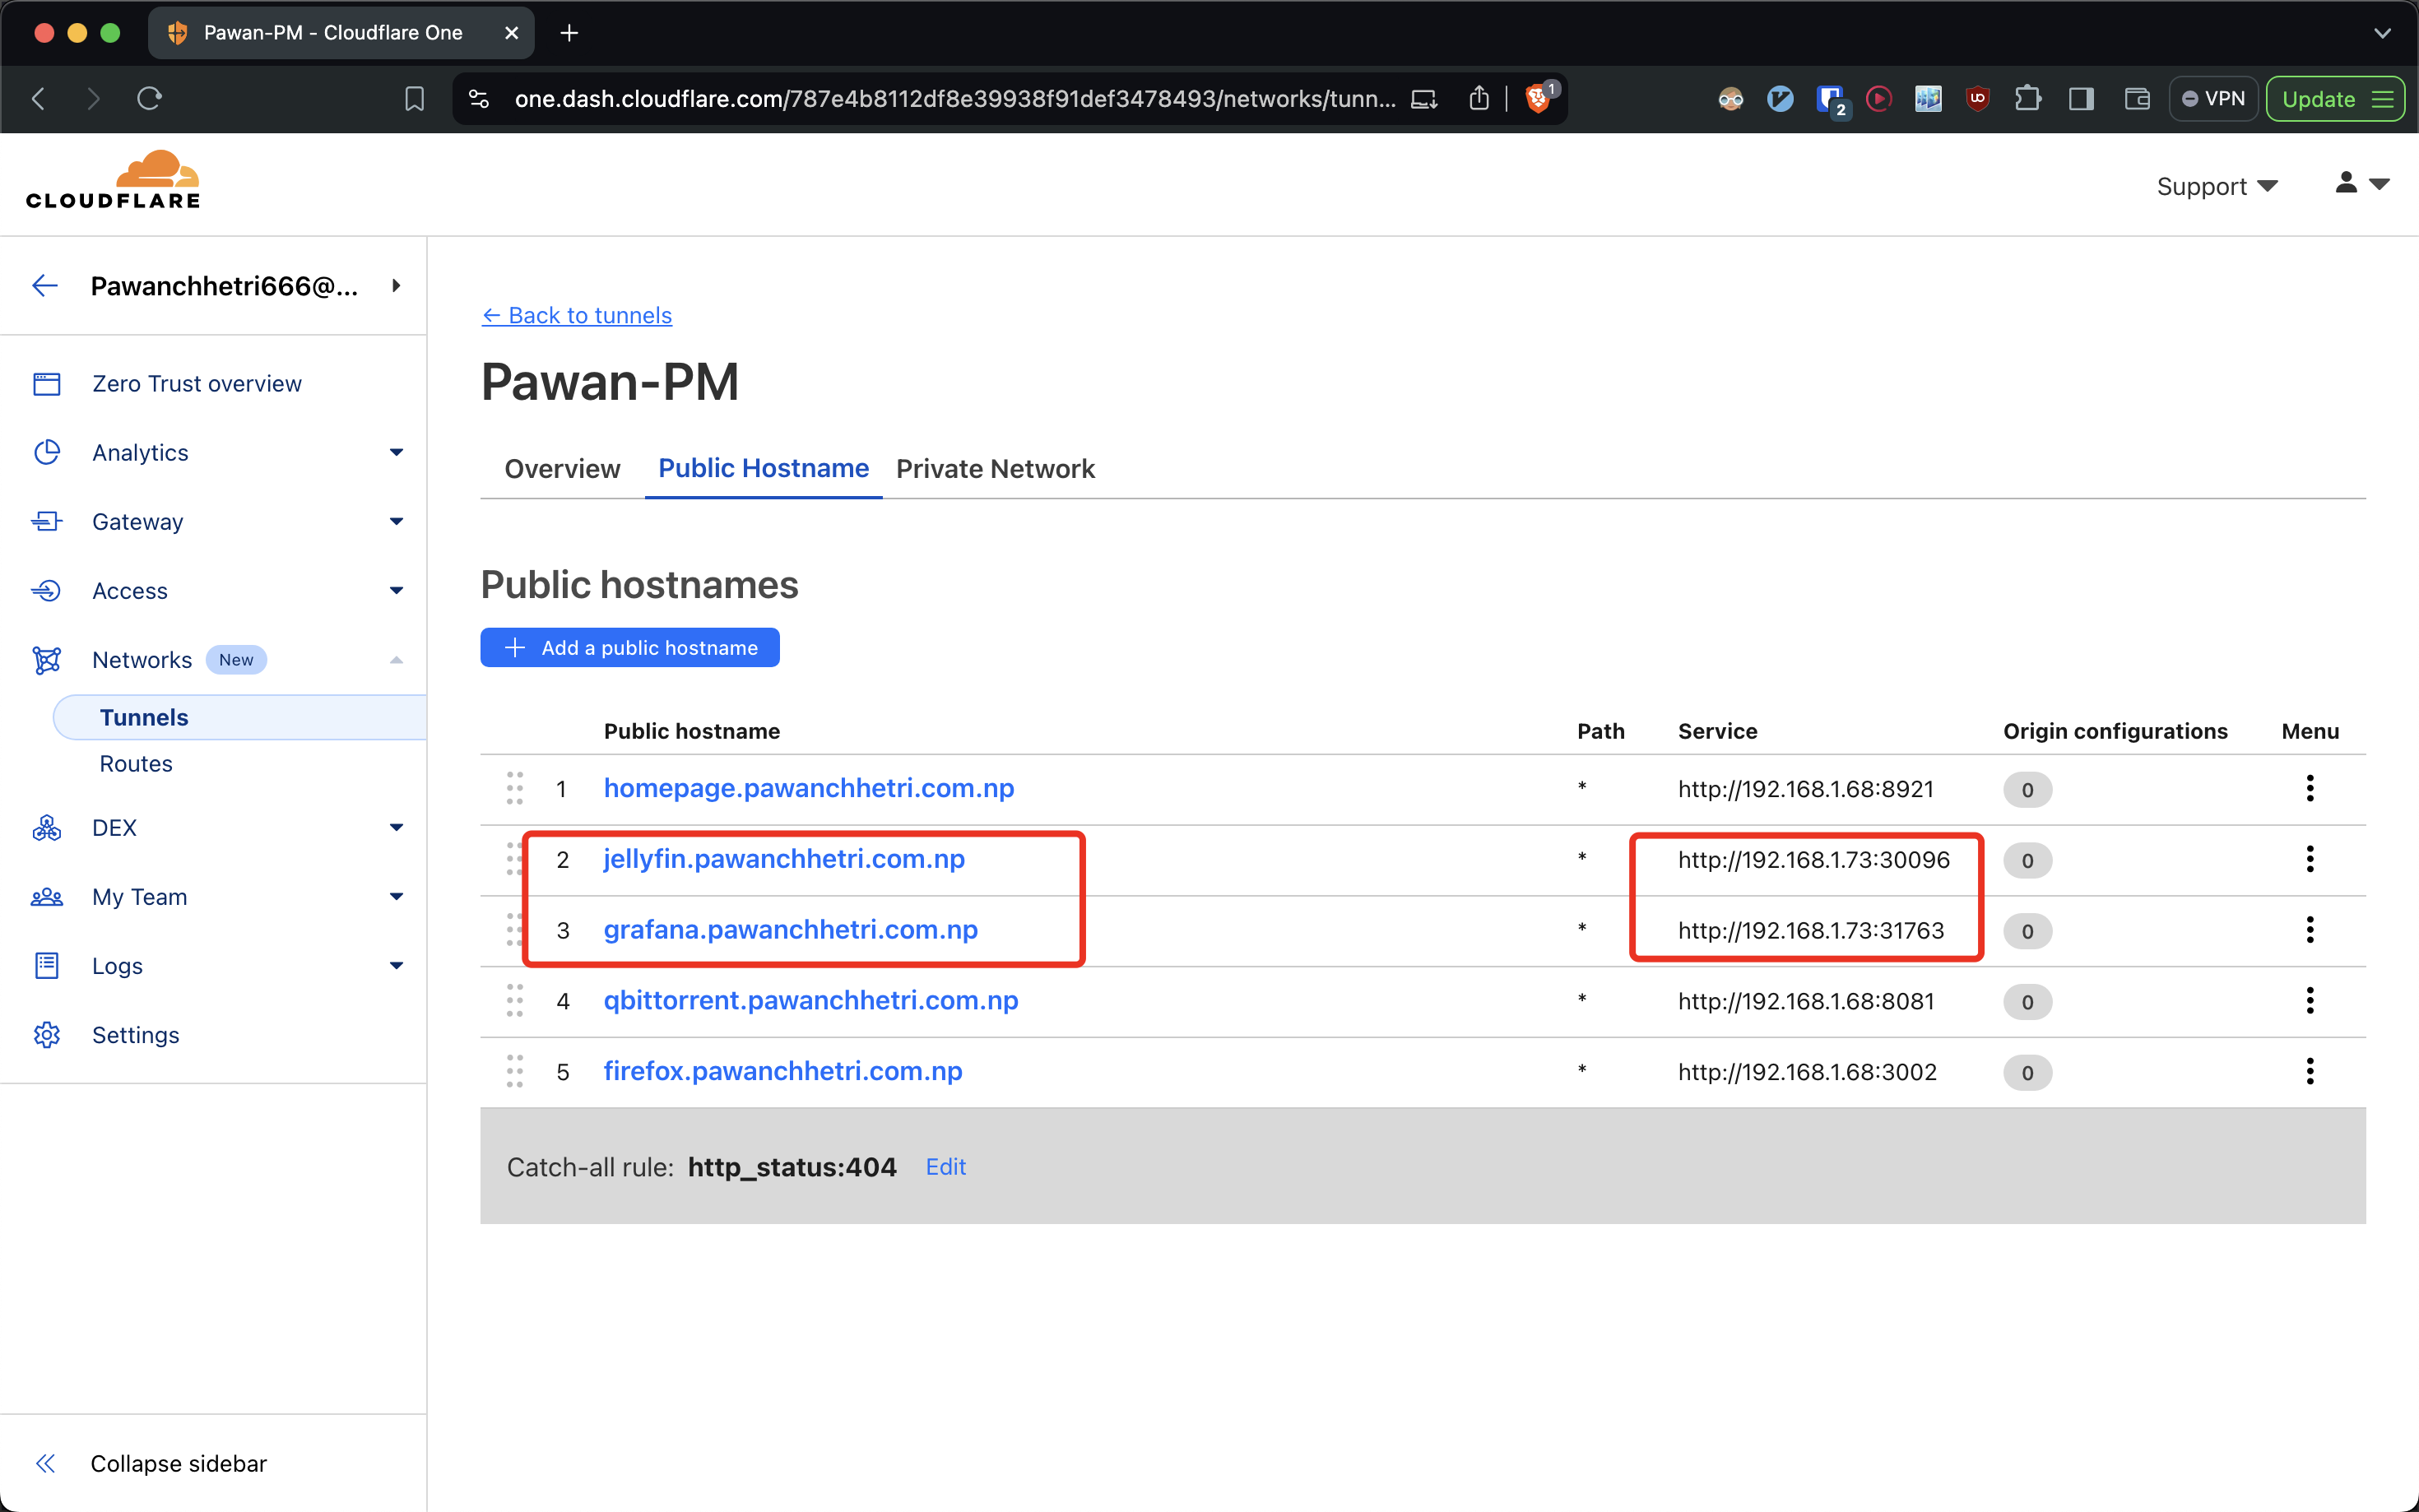 The socket exposed by k8s NodePort service is mapped.
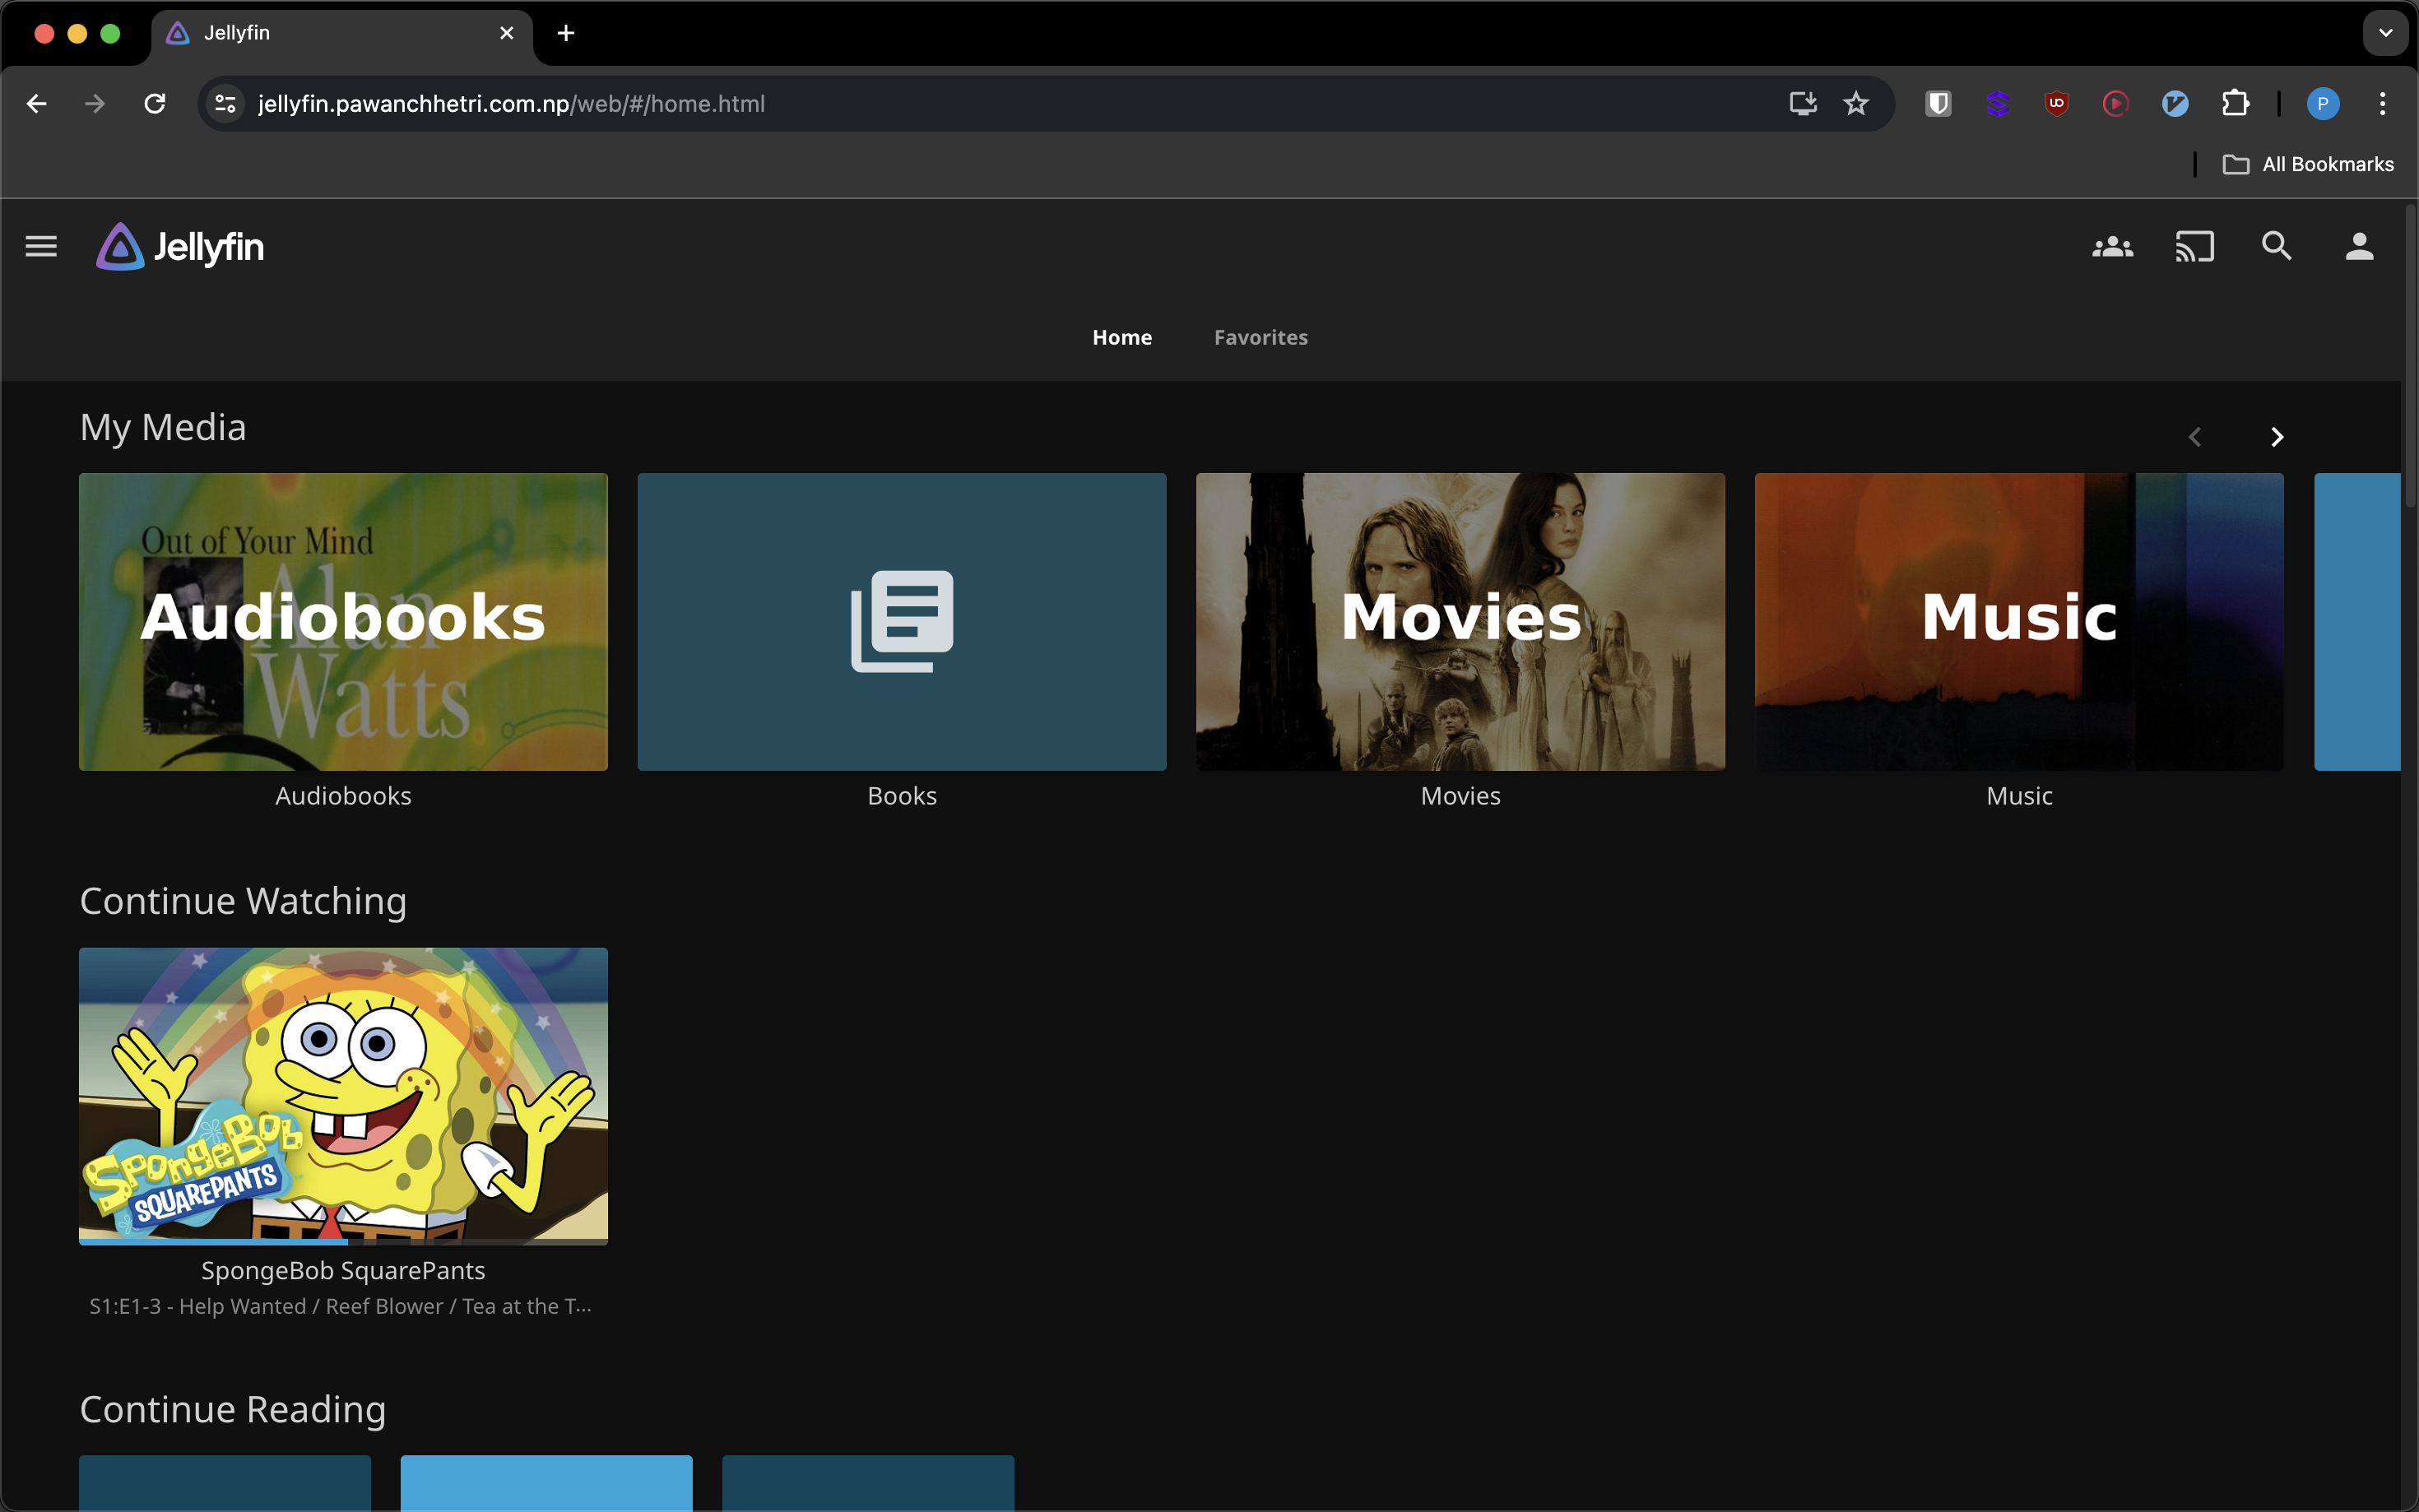 mapping for different media set on jellyfin UI.
4. Monitoring Stack#
Monitoring the server and services is important because knowing what’s going on with the server and services without opening server console and terminal to type commands is always handy.
Using Helm-charts is the easiest way to set up Server and k8s application monitoring. I’m using the kube-prometheus-stack which allows:
- Prometheus for metrics collection
- Grafana for dashboards visualization
- Alertmanager configuration (If you want alerting based on the threshold set)
Run the below commands to set it up.
`https://artifacthub.io/packages/helm/prometheus-community/kube-prometheus-stack`
helm repo add prometheus-community https://prometheus-community.github.io/helm-charts
helm repo update

helm install [RELEASE_NAME] prometheus-community/kube-prometheus-stack
helm install my-promethues-grafana  prometheus-community/kube-prometheus-stack

helm show values prometheus-community/kube-prometheus-stack > values.yaml
helm upgrade my-promethues-grafana prometheus-community/kube-prometheus-stack -f values.yaml

helm upgrade [RELEASE_NAME] prometheus-community/kube-prometheus-stack

helm uninstall [RELEASE_NAME]
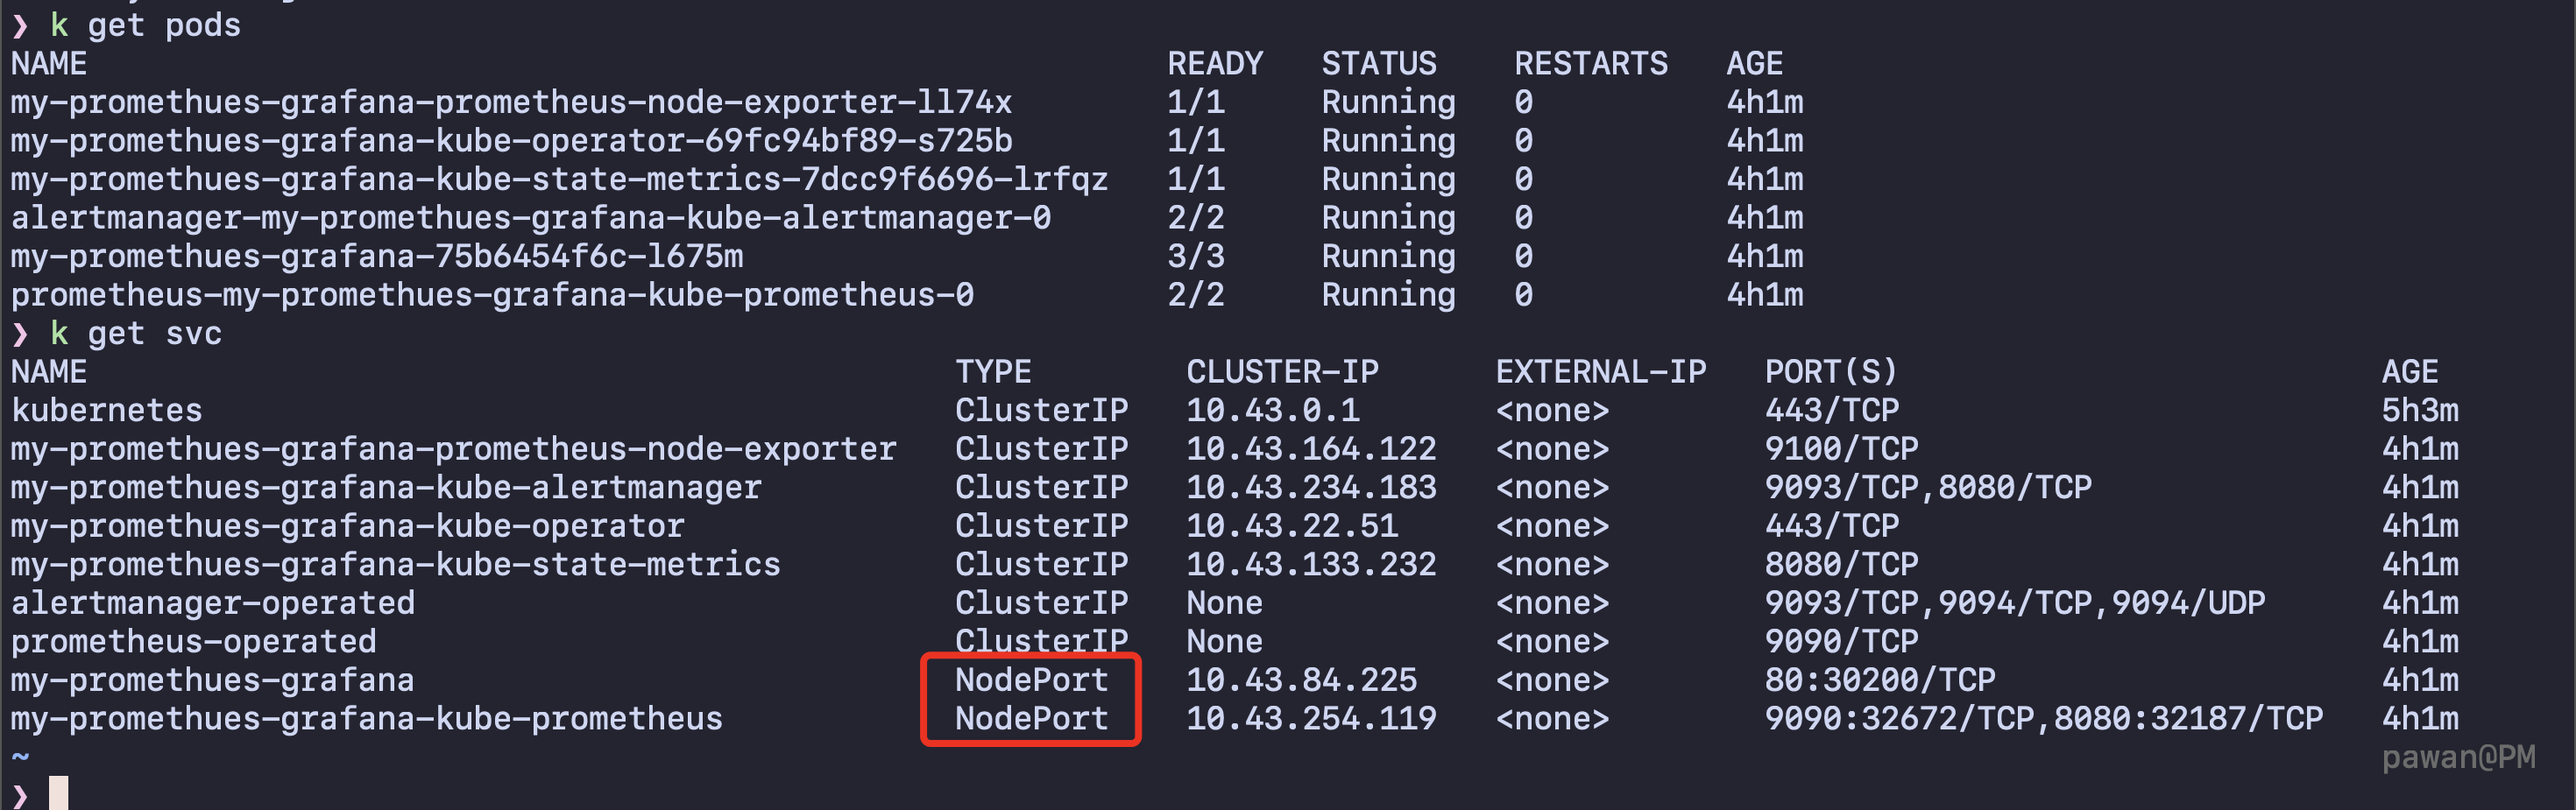 Grafana, prometheus pods are mapped with NodePort.
Tons of premade dashboards are present officially and unofficially, which are good enough for this sort of setup. Grab an Id from your dashboard of your choice and import it from grafana_dashboards.
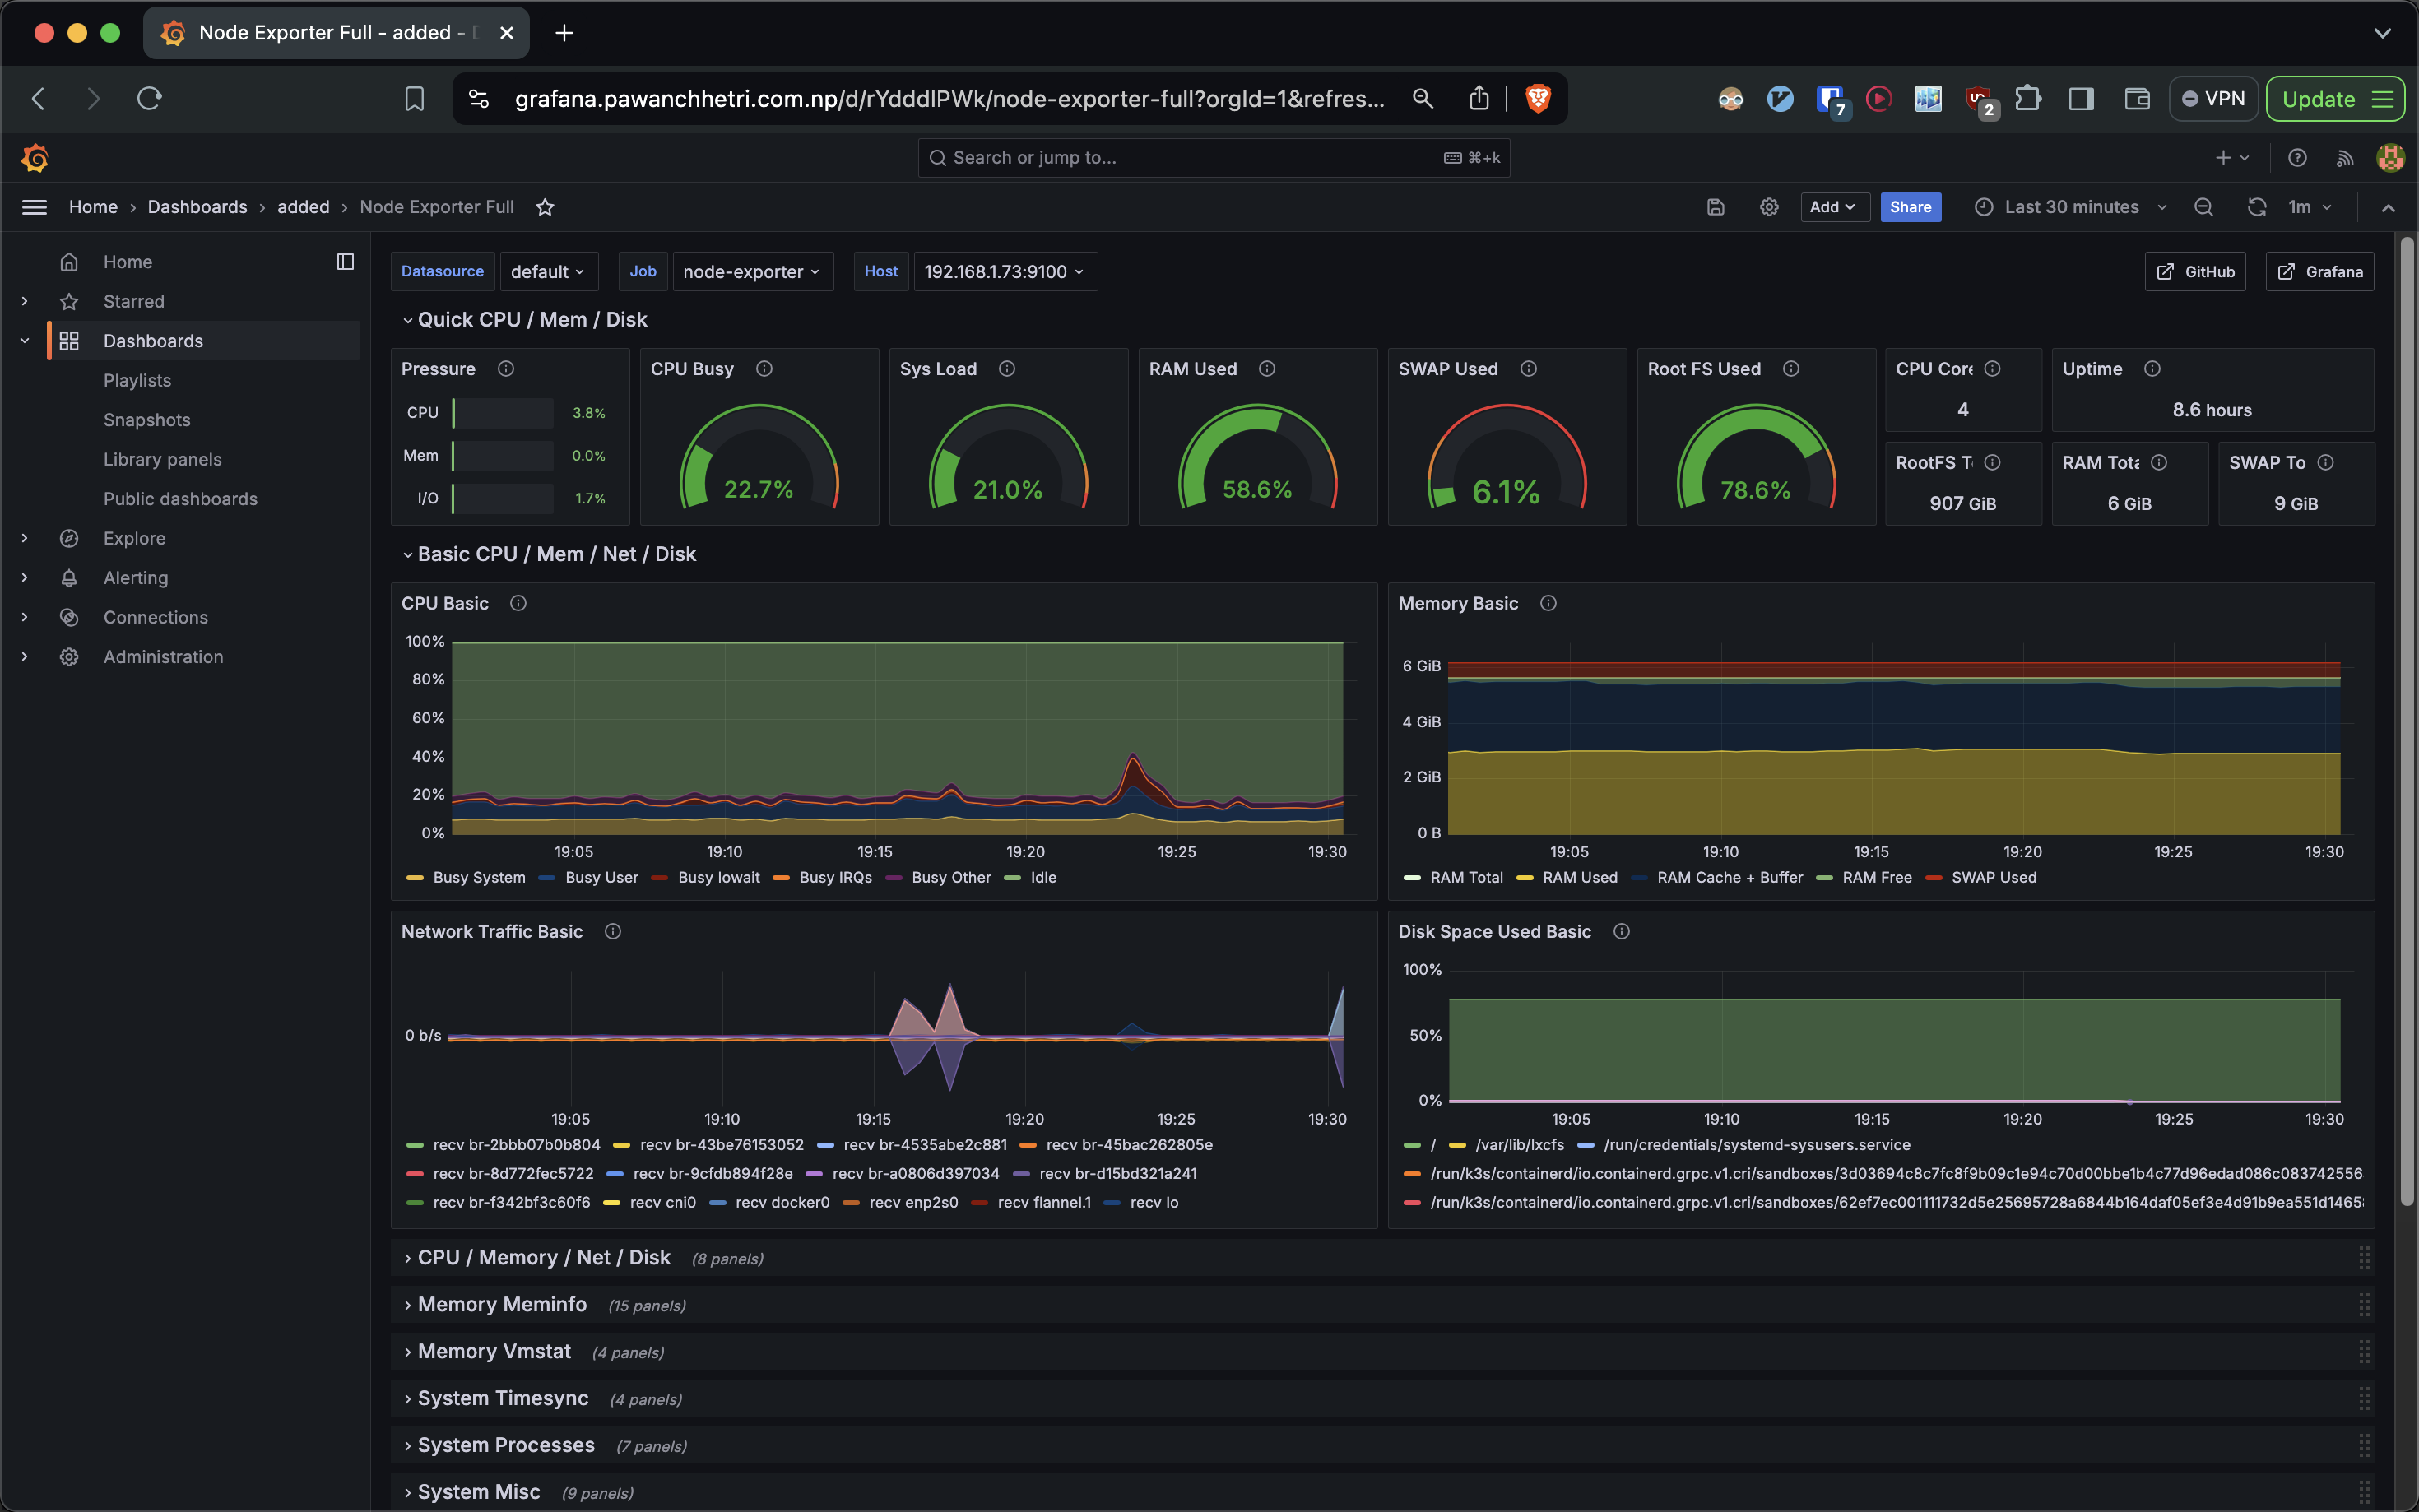
Node Exporter Full:ID 1860
Future Enhancements#
- Cloudflare terrafrom - Domain/Subdomain configuration using terrafrom
- GitOps Workflow - ArgoCD implementation
- Storage Scaling - Using a NAS
- HA Configuration - Multi-node cluster
- Automated Backups - Velero integration